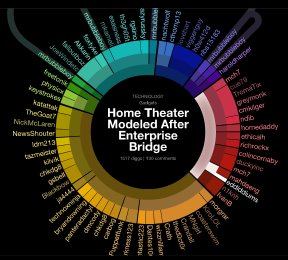
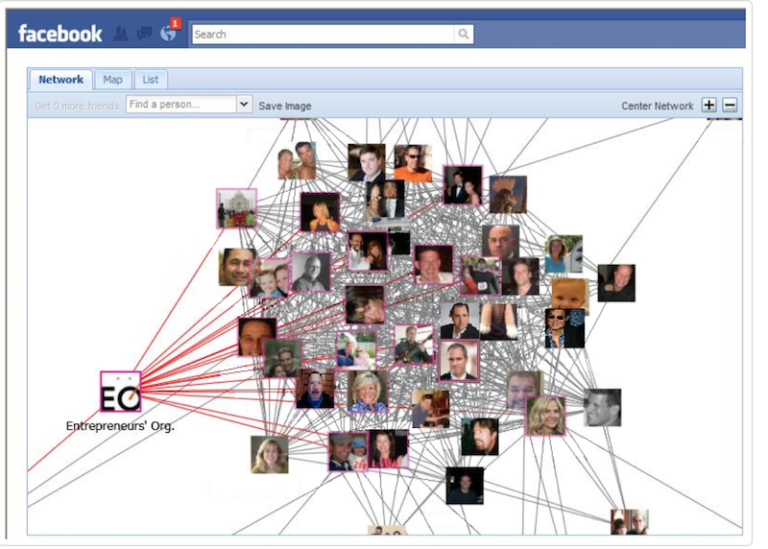
Digging into Digging into Data Books: A Couple Choice Volumes for Data Visualisation
Data visualisation has become very vogue in the digital humanities community. Although there have been a scattering of brave practitioners over the past few years, only very recently has this interdisciplinary area started to feature prominently at DH conferences as…

 creative juices were sought a middle ground between a clear systematic approach and yearning to find break out of these same systems, I discovered the work of George and Iain Bain . - father and son. ... While I may have toyed with the idea of putting little knots into a font (in my font design days) I don't think I thought of taking the Bain system and assembling a font that could be used to create patterns using individual letters as the building blocks. ... This is not a criticism of the tool itself (I think it is brilliant and applaud the systematic devising of pattern that went into it), merely a reflection on the nature of the process and of when the tool subtracts from the end result.