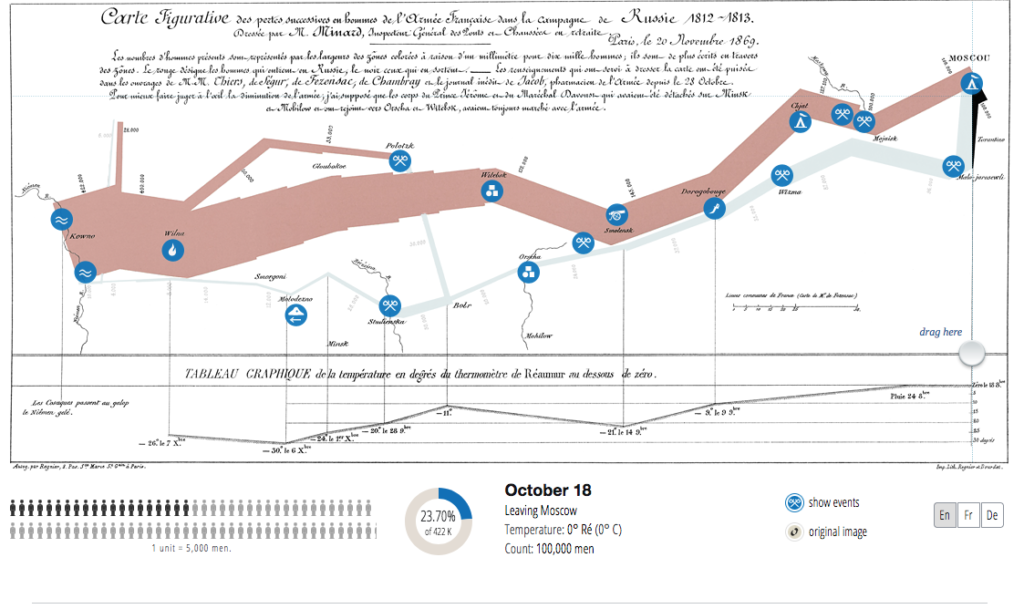
CharlesJ Minard’s Map of Napoleon’s Russian Campaign of 1812
Norbert Landsteiner has created a powerfully augmented interactive visualisation of Minard’s equally powerful static representation of the campaign. Recently made famous largely as a result of Edward Tufte’s featuring it in his seminal, The Visual Display of Quantitative Information, the static visualisation combined 6 vectors of data and tells a compelling story. Adding adding interactivity engages the viewer and invites them to write their own story.